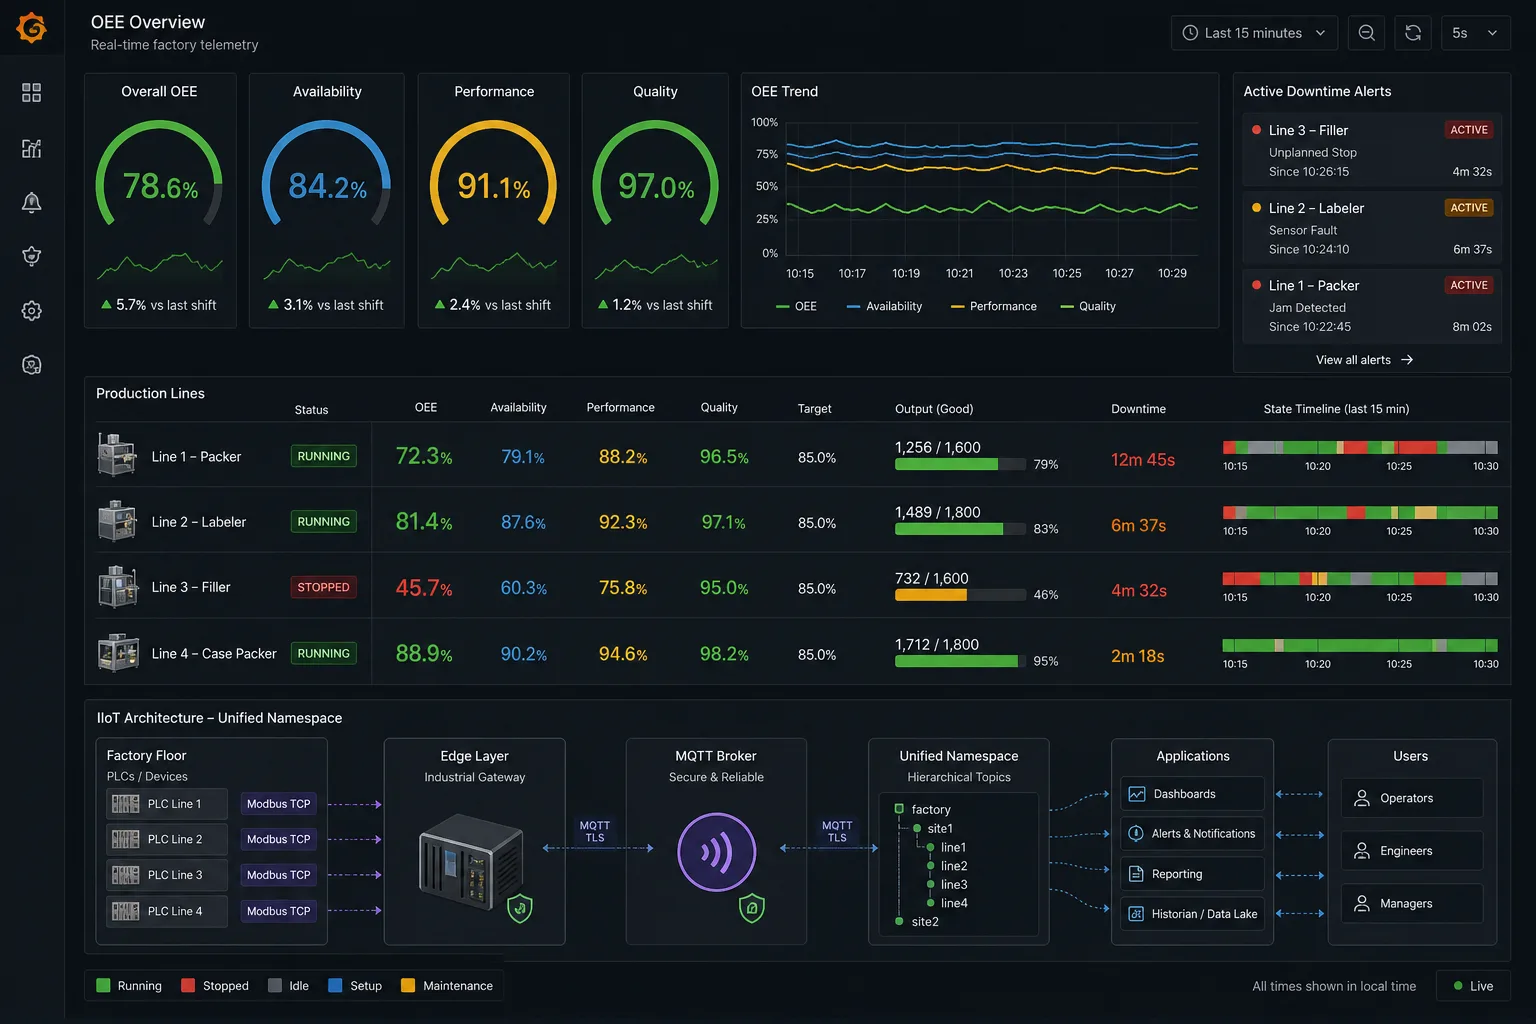
From Paper Reports to Live Telemetry
The facility — a single-site manufacturing plant running three production lines on legacy equipment — had no real-time visibility into operations. Shop-floor PLCs spoke Modbus but had no path to operations dashboards. Supervisors filled end-of-shift forms while management discovered downtime and throughput problems hours too late.
Plant manager Karen described the blind spot: "I'd get a paper report at the end of shift telling me Line 2 was down for forty minutes. By then the maintenance team had gone home and we'd already missed the production target for the day. Enterprise SCADA vendors wanted six figures for dashboards we could sketch on a whiteboard."
Quotes from enterprise SCADA vendors priced basic visibility out of reach — per-seat licensing, historian modules, and annual maintenance contracts that scaled poorly for a single-site plant.
UNS Architecture at a Glance
We adopted a Unified Namespace pattern so every machine state change publishes to a single MQTT topic hierarchy — no point-to-point integrations per machine.
Example topic structure:
factory/line1/machine1/status
factory/line1/machine1/cycle_count
factory/line1/machine1/fault_code
factory/line2/machine3/run_state
Stack components:
- Modbus gateway — edge device polls legacy PLCs and normalises registers to JSON payloads
- MQTT broker (Mosquitto) — lightweight, on-prem, no per-tag licensing
- InfluxDB — time-series store for cycle counts, fault codes, and run states
- Grafana — custom OEE, downtime Pareto, and shift comparison dashboards
Operators see live line status; management sees cross-shift rollups without waiting for paper handoffs.
Why Not Traditional SCADA?
| Factor | Enterprise SCADA quote | UNS + Grafana stack |
|---|---|---|
| Initial licensing | ~$180,000 | ~$12,000 (hardware + deployment) |
| Annual maintenance | ~$25,000 | $0 (self-maintained) |
| Per-seat dashboard licensing | Yes | No |
| Historian module | Separate SKU | InfluxDB included |
| Dashboard ownership | Vendor-controlled | Fully custom in Grafana |
| Vendor roadmap dependency | High | Low (open-source stack) |
Per-seat licensing, historian modules, and annual maintenance contracts scaled poorly for a single-site plant that only needed OEE and downtime alerts. The self-hosted stack delivers predictable capital cost with dashboards and alert rules the client controls.
Automated Downtime Response
Threshold rules in Grafana route SMS and email when lines stop unexpectedly or cycle times drift beyond SPC limits. Maintenance gets signal while the event is still happening, not at the end of the shift.
Example alert flow:
- Line 2 cycle count stops incrementing for >3 minutes
- Grafana alert fires → SMS to maintenance lead and email to plant manager
- Maintenance acknowledges and logs fault code from dashboard
- Downtime duration and root cause recorded in InfluxDB for shift reporting
Karen: "The first time we got an SMS that Line 2 was down, maintenance was on it in eight minutes. Previously we'd find out at end of shift. That one alert paid for the project."
Results After Six Months
| Metric | Before | After 6 months |
|---|---|---|
| OEE visibility | End-of-shift paper reports | Live dashboard |
| Mean time to detect unplanned downtime | 4+ hours | <5 minutes |
| Unplanned downtime events per month | ~18 | ~11 (faster response) |
| SCADA licensing cost (annual) | $0 (not deployed) vs $205k quoted | $0 ongoing |
| Shift report compilation time | 45 minutes | 5 minutes (auto-generated) |
Engagement Model
Single delivery project: Modbus gateway deployment, MQTT broker setup, InfluxDB configuration, Grafana dashboard build, alert routing, and operator training. No vendor licensing fees, no subscription dependency — the plant owns the infrastructure outright.
This project sits in our Industrial IoT practice — Unified Namespace design, legacy PLC bridging, and Grafana operational dashboards without enterprise SCADA price tags.