Flying Blind Across Multiple Sites
The client — a distributed business operating facilities and remote assets across Queensland and northern NSW — had grown faster than their monitoring stack. Each site ran different equipment, different connectivity, and different ad hoc visibility tools. Operations managers discovered problems hours after they started, not when they started.
IT lead Marcus described the frustration: "We were paying a SaaS monitoring vendor per device, per message, and per dashboard user. Every time we added a site, the bill jumped. And the dashboards still did not show what our operators actually needed to see."
The previous vendor quoted six figures annually for basic cross-site rollups — pricing that assumed enterprise procurement budgets the client did not have.
Architecture at a Glance
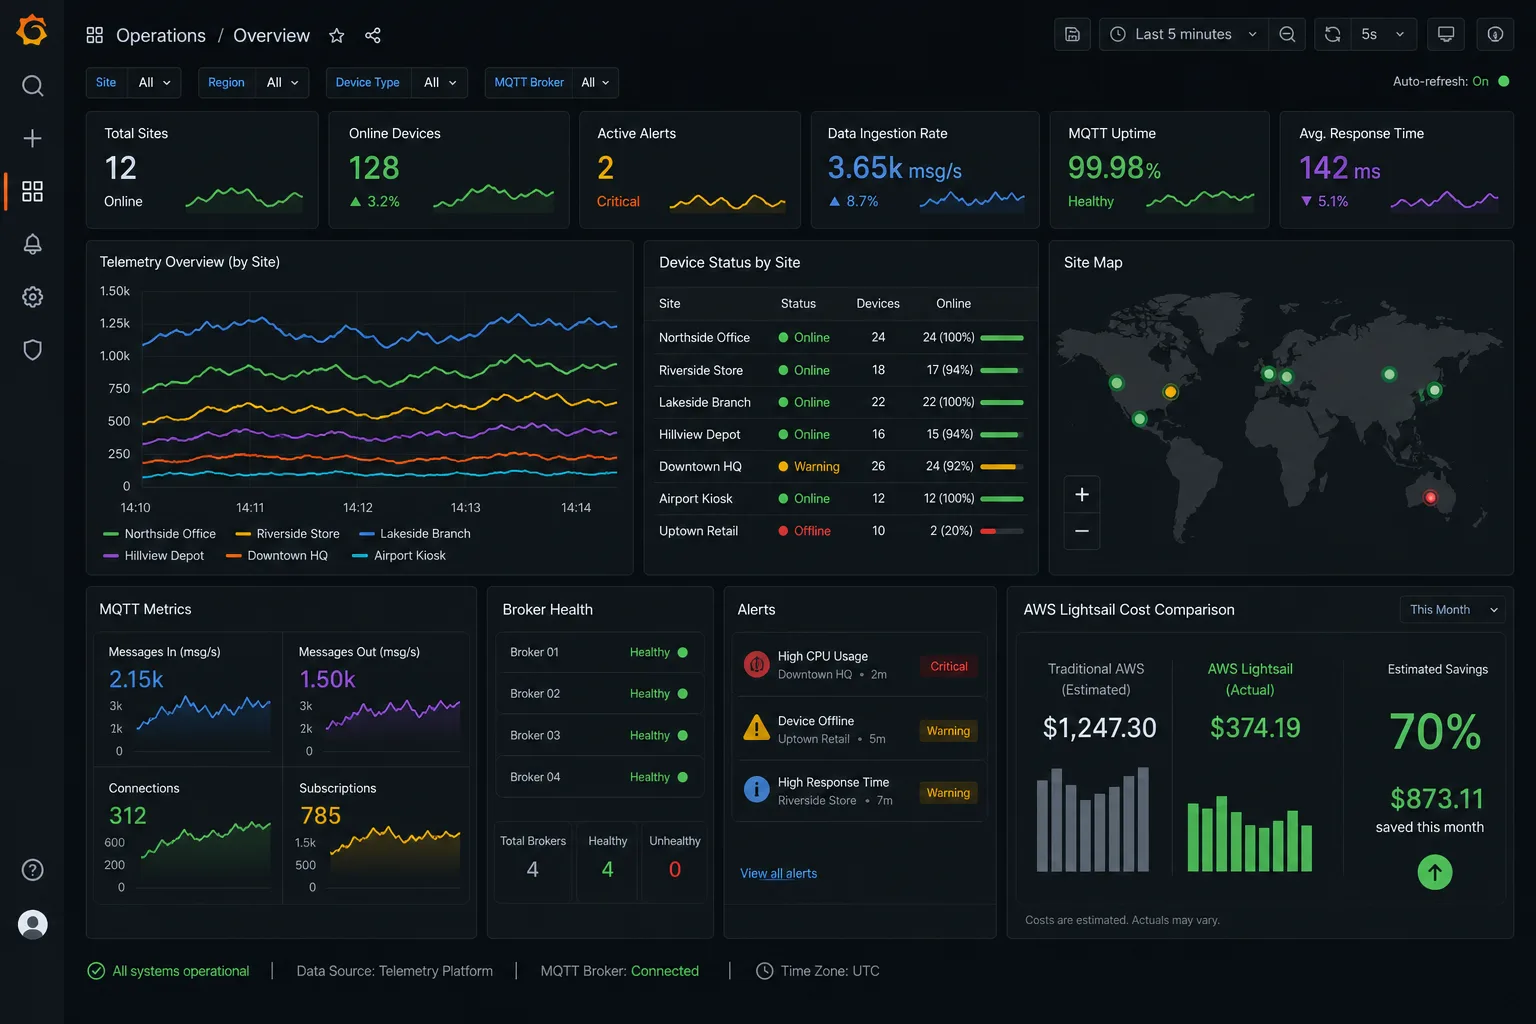
The monitoring stack runs on a single AWS Lightsail instance ($10/month) hosting:
- MQTT broker (Mosquitto) for lightweight device telemetry ingestion
- InfluxDB for time-series storage with configurable retention policies
- Grafana for custom dashboards tuned to the client's operational KPIs
Sensors and edge gateways publish to MQTT topics; a small Node.js bridge writes to InfluxDB. Grafana queries InfluxDB directly — no per-message SaaS fees, no query metering.
flowchart LR
    Sensors["Edge sensors & gateways"]
    MQTT["MQTT broker\nMosquitto"]
    Bridge["Node.js bridge"]
    Influx["InfluxDB"]
    Grafana["Grafana dashboards"]

    Sensors --> MQTT --> Bridge --> Influx --> Grafana
Operators see site-level status at a glance. Management sees cross-site rollups without waiting for weekly reports compiled from spreadsheets.
Why Not Managed Monitoring?
| Factor | Previous SaaS stack | Lightsail + Grafana |
|---|---|---|
| Pricing model | Per device, per message, per user | Flat $10/month instance |
| Dashboard ownership | Vendor-controlled templates | Fully custom, version-controlled in Git |
| Query limits | Metered; overages billed monthly | Unlimited within instance capacity |
| Vendor lock-in | Proprietary agent and historian | Open-source stack; portable |
| Alert routing | Third-party incident platform fees | Direct email and SMS from Grafana |
The client's previous stack charged per device, per message, and per dashboard user. As their footprint grew across multiple sites, costs scaled linearly while value did not. The Lightsail approach provides predictable flat-rate pricing regardless of message volume spikes during peak operations.
Key Design Decisions
- Self-hosted Grafana — full dashboard ownership, no seat licensing
- Immutable config in Git — dashboards and alerts version-controlled and reproducible
- Role-based access — operators see site-level views; management sees cross-site rollups
- Alert routing — critical thresholds push to email and SMS without a third-party incident platform
Threshold rules route alerts when asset temperatures drift, connectivity drops, or cycle times exceed SPC limits. Maintenance gets signal while the event is still happening, not at end of shift.
Results After Ninety Days
| Metric | Before | After 90 days |
|---|---|---|
| Monthly monitoring infrastructure cost | ~$1,850 | ~$550 |
| Dashboard refresh latency | 8–15 seconds | <1 second |
| Sites with real-time visibility | 2 of 6 | 6 of 6 |
| Mean time to detect asset fault | 4+ hours | <5 minutes |
| Monthly retainer to MSP | $2,400 | $0 (hourly as-needed) |
Marcus: "We cut monitoring costs by seventy percent and actually see more than we did before. The dashboards show what our operators asked for — not what a vendor decided was standard."
What They Did Not Change
Edge sensors and gateways kept their existing firmware and MQTT publish patterns. The integration added a central broker, time-series store, and Grafana layer — no replacement of field hardware, no rip-and-replace of site-level equipment.
Engagement Model
Single architectural delivery: stack design, Lightsail deployment, sensor onboarding, Grafana dashboard build, alert configuration, and handover runbook. No retainer, no per-device licensing — the client owns the AWS account, dashboards, and alert rules.
This project aligns with our IoT & Smart Systems practice — custom telemetry, edge integration, and cost-efficient cloud architecture for operational visibility.