Architecting Digital Excellence for Tomorrow
We transform businesses through innovative IoT solutions, intelligent automation, and cutting-edge software development. Partner with Brisbane's premier technology consultancy.


Industrial-Grade Technology Solutions
Specializing in IoT, industrial automation, and enterprise software solutions that transform operations and drive measurable business outcomes.
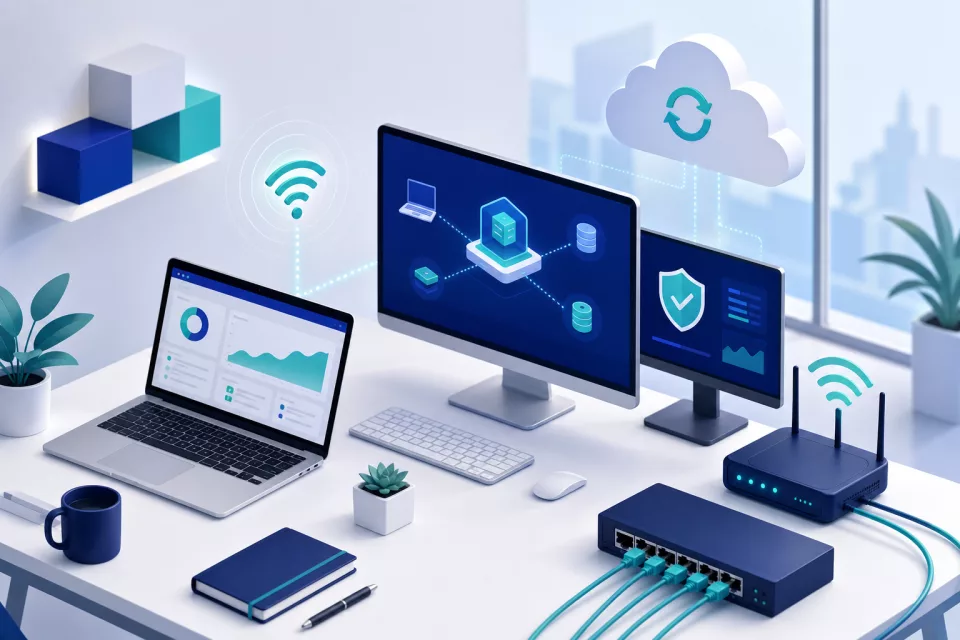
IoT & Smart Systems
Transform your operations with intelligent IoT solutions. From sensor networks to edge computing, we create connected ecosystems that provide real-time insights and automated control.
- Industrial IoT Implementation
- Smart Building Solutions
- Edge Computing & Analytics
- Predictive Maintenance Systems
Industrial Automation
Streamline manufacturing and industrial processes with intelligent automation solutions. Increase efficiency, reduce costs, and improve safety through smart control systems.
- SCADA Systems
- PLC Programming
- Process Optimization
- Quality Control Automation
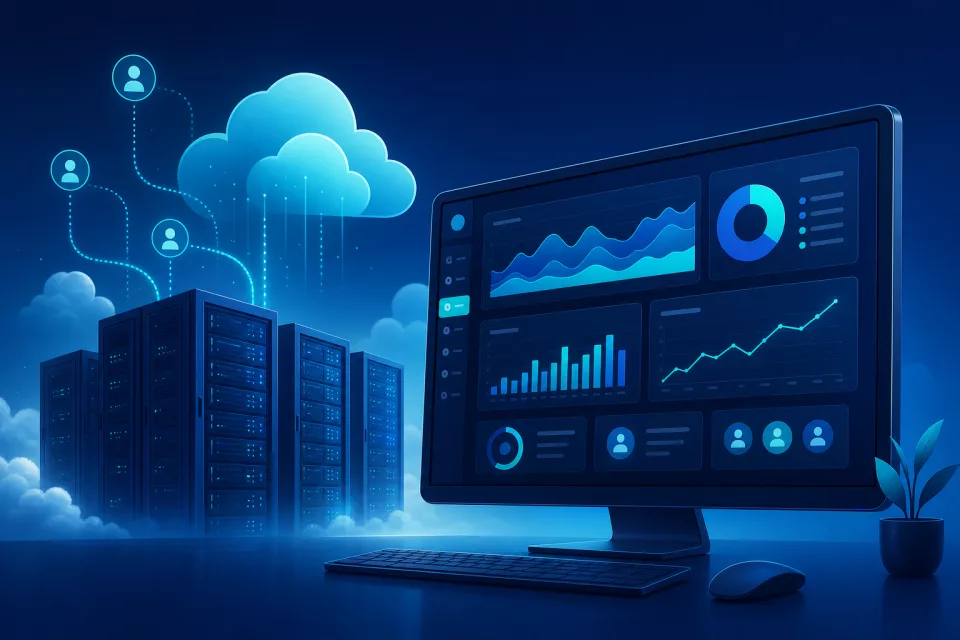
SaaS Platform Development
Build scalable, cloud-native SaaS applications that grow with your business. Our platforms are designed for performance, security, and seamless user experiences.
- Multi-tenant Architecture
- API-first Development
- Microservices Design
- Real-time Collaboration
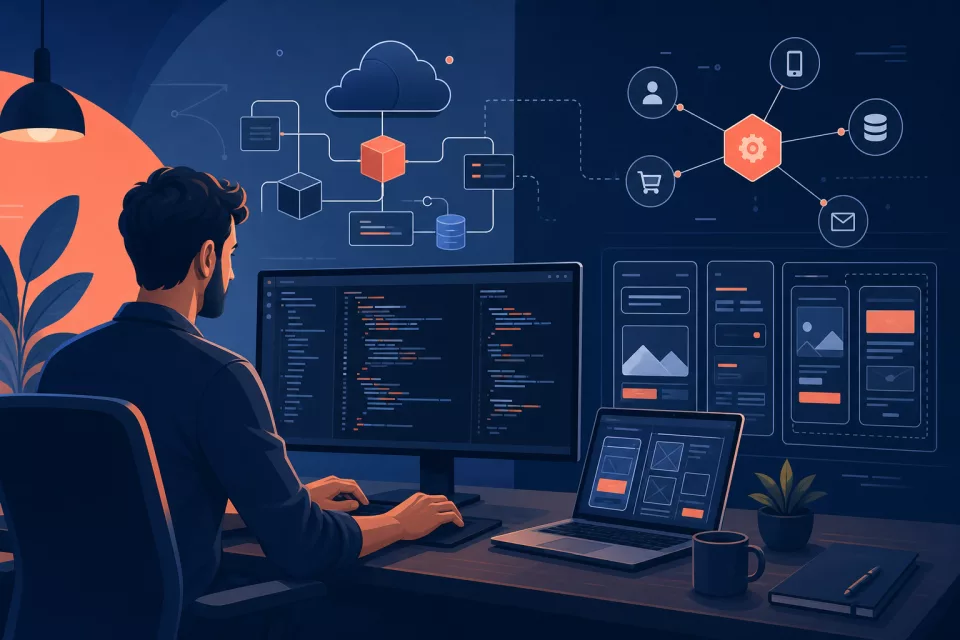
Custom Software Solutions
Bespoke software solutions tailored to your unique business requirements. From web and mobile applications to enterprise integrations, we deliver high-performance solutions.
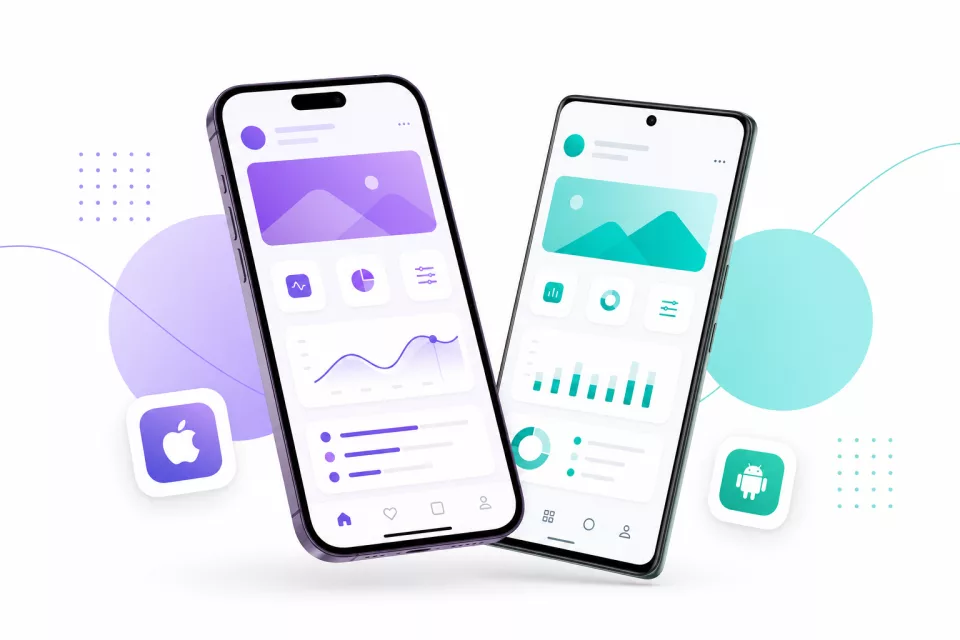
- Web & Mobile Applications
- Enterprise System Integration
- Legacy System Modernization
- Ongoing Support & Maintenance
Managed Technology
Your IT + automation partner for modern business. Cloud management, cybersecurity, business automation, and AI workflows in one seamless technology partnership.
- Managed IT Support
- Cloud & Microsoft 365
- Cybersecurity & Compliance
- Business Automation & AI
Transforming Industries Through Innovation
We deliver specialized solutions across key industries, leveraging our deep technical expertise and industry knowledge.
Manufacturing Excellence
Smart factory solutions with predictive maintenance, quality control automation, and real-time production monitoring.
Smart Buildings
Intelligent building management systems for energy optimization, security, and occupant comfort.
Logistics & Supply Chain
End-to-end visibility and optimization of supply chain operations with real-time tracking and analytics.
Energy Management
Smart grid solutions and renewable energy integration for sustainable and efficient power management.
Powered by Cutting-Edge Technologies
Cloud & Infrastructure
Development
IoT & Data
Brisbane, QLD's Technology Innovation Hub
Founded with a vision to transform businesses through technology, OceanSoft Solutions has become Brisbane's premier technology consultancy. We combine deep technical expertise with industry knowledge to deliver solutions that drive real business value.
Mission-Driven
Empowering businesses through innovative technology solutions that create lasting competitive advantages.
Innovation First
We stay at the forefront of technology trends, ensuring our clients benefit from the latest innovations.
Partnership Approach
We work as an extension of your team, providing ongoing support and strategic guidance.
Ready to Transform Your Business?
Let's discuss how our innovative technology solutions can drive your business forward. Our team is ready to help you navigate your digital transformation journey.
Phone
0403 000 196
contact@oceansoftsol.com
Location
Brisbane, Queensland
Australia
We typically respond within 2 hours during business hours